Preview

Data visualization with QlikView Training


Data visualization with QlikView Training

Build expertise in various visualization techniques, objects, and operations using QlikView

  • Covers the basic and advanced visualization techniques on QlikView
  • Learn, prepare and analyze your data with QlikView
  • Hands-on sessions on the front end and back end components of QlikView
  • Case studies on QlikView data transformation and exploratory analysis
  • Interactive and project-oriented lab sessions on QlikView
  • Get Free E-learning Access to 100+ courses

  • Learn from anywhere in the world. Connect with an Instructor in real time.
  • Attend Live Class from a PC or Mobile.
  • Ask questions from an Instructor in real time over voice & chat.
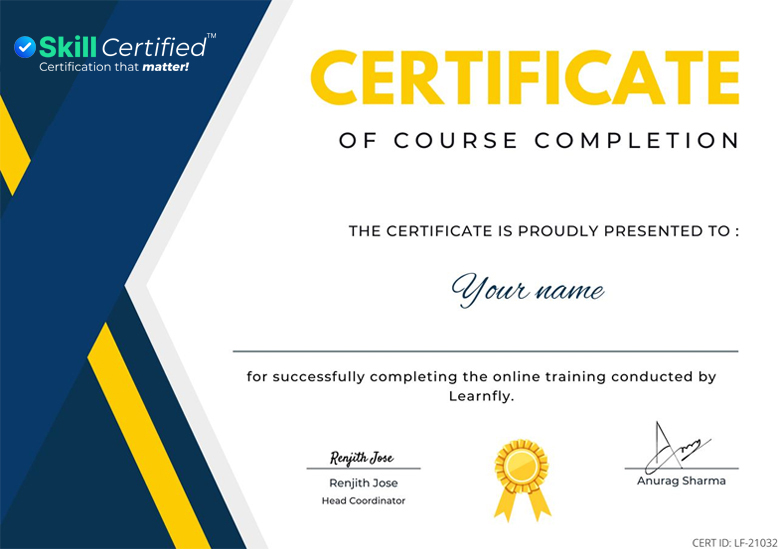
  • Includes Certificate of Completion.
  • Official Exam & Certification Assitance.
  • Get 30 Days free after class support.

Join a next available Live Class:

This course training is available on request only. Send us your request with preferred date & Time & our training advisor will get back to you within 24 business hours.

Tell Us Your Preferred Starting Date

Enquire for more information

Course Description

About the Course

Data visualization is among the top skills to have in order to land a job in this data-driven job market. Using skilful data visualization techniques, information can be transformed into useful visual presentations that can be presented to stakeholders to enhance business. QlikView is among the foremost Business Intelligence and data visualization tools, very popular because of its ease of learning and deploying. If data analysis is your chosen career path then mastery of Qlikview is a sure route to getting employed!

A QlikView certification can enable businesses and individuals to present data in a visually appealing way to ensure better comprehension. This data analysis tool has transformed business intelligence for over 24000 organizations the world over, by consolidating and visually analyzing data in a simple and effective manner.

Course Curriculum

Course # : OV-0050
Exam : Data visualization with QlikView Course

Data visualization with QlikView Training

Objectives

  • Introduction to QlikView: Understand the fundamentals of QlikView, its architecture, and its role in data visualization.
  • Data loading and modeling: Learn how to load data into QlikView and create a data model for effective visualization.
  • Creating basic visualizations: Explore the different types of visualizations available in QlikView, such as bar charts, line charts, and pie charts, and learn how to create them.
  • Advanced visualization techniques: Dive deeper into QlikView's capabilities and discover advanced techniques, including drill-downs, treemaps, and heatmaps.
  • Interactive features: Learn how to make your visualizations interactive by adding filters, selections, and dynamic charts to enhance user engagement.
  • Expression and dimension handling: Understand how to work with expressions to calculate and manipulate data, as well as how to handle dimensions for effective data grouping.
  • Dashboard design principles: Gain insights into best practices for designing visually appealing and user-friendly dashboards in QlikView.
  • Data storytelling: Discover how to use QlikView to tell compelling stories with data, presenting insights and analysis in a meaningful and impactful way.
  • Collaboration and sharing: Explore methods for collaborating with others and sharing your QlikView applications to promote data-driven decision-making across your organization.
  • Performance optimization: Learn techniques to optimize the performance of your QlikView applications, such as data model optimization, data reduction techniques, and memory management strategies.

Target Audience

  • Data Scientists
  • Business Analysts
  • Project Managers
  • Statisticians
  • Designers
  • IT Architects
  • Software Developers
  • Testing Professionals
  • BI & Reporting Professionals
  • Data Analysts & Visualization experts
  • Graduates who are aiming to build a career in visualization & analysis

Prerequisites

  • Basic idea of programming languages
  • Recommended to have familiarity with Databases, SQL, and Data WareHouse
  • Basic understanding of Reporting and BI.

Why Data visualization with QlikView Training from SkillCertified™

  • Live Interactive Learning
    • World-Class Instructors
    • Expert-Led Mentoring Sessions
    • Instant doubt clearing
  • Lifetime Access
    • Course Access Never Expires
    • Free Access to Future Updates
    • Unlimited Access to Course Content
  • 24x7 Support
    • One-On-One Learning Assistance
    • Help Desk Support
    • Resolve Doubts in Real-time
  • Hands-On Project Based Learning
    • Industry-Relevant Projects
    • Course Demo Dataset & Files
    • Quizzes & Assignments
  • Industry Recognised Certification
    • SkillCertified Training Certificate
    • Graded Performance Certificate
    • Certificate of Completion
  • Like what you hear from our learners?

    Take the first step!

    Drop us query
Be Amazed with Online Learning Experience
Future is fast forwarding towards online learning & now it’s becoming easy for everyone to take a world class training from anywhere in the world. Listen from Learnfly Live recent alumni’s studying around the globe.

Get an e-Certificate of Completion

Get a e-Certificate of Course Completion after successfully completing your live class with SkillCertified™. Share & showcase your proud achievement with your friends & colleagues. Join a live class today & start learning online from anywhere: